Enhanced Dashboard Features
We've introduced several enhancements to the dashboard to improve navigation and data interaction.
- Dashboard Chart Drill-Down: You can now drill down into dashboard charts to view detailed records in the filtered list view.
- Dashboard Charges Pie Chart Update: The “Charges” pie chart has been replaced with an "Insurance Value" pie chart for a more relevant financial overview.
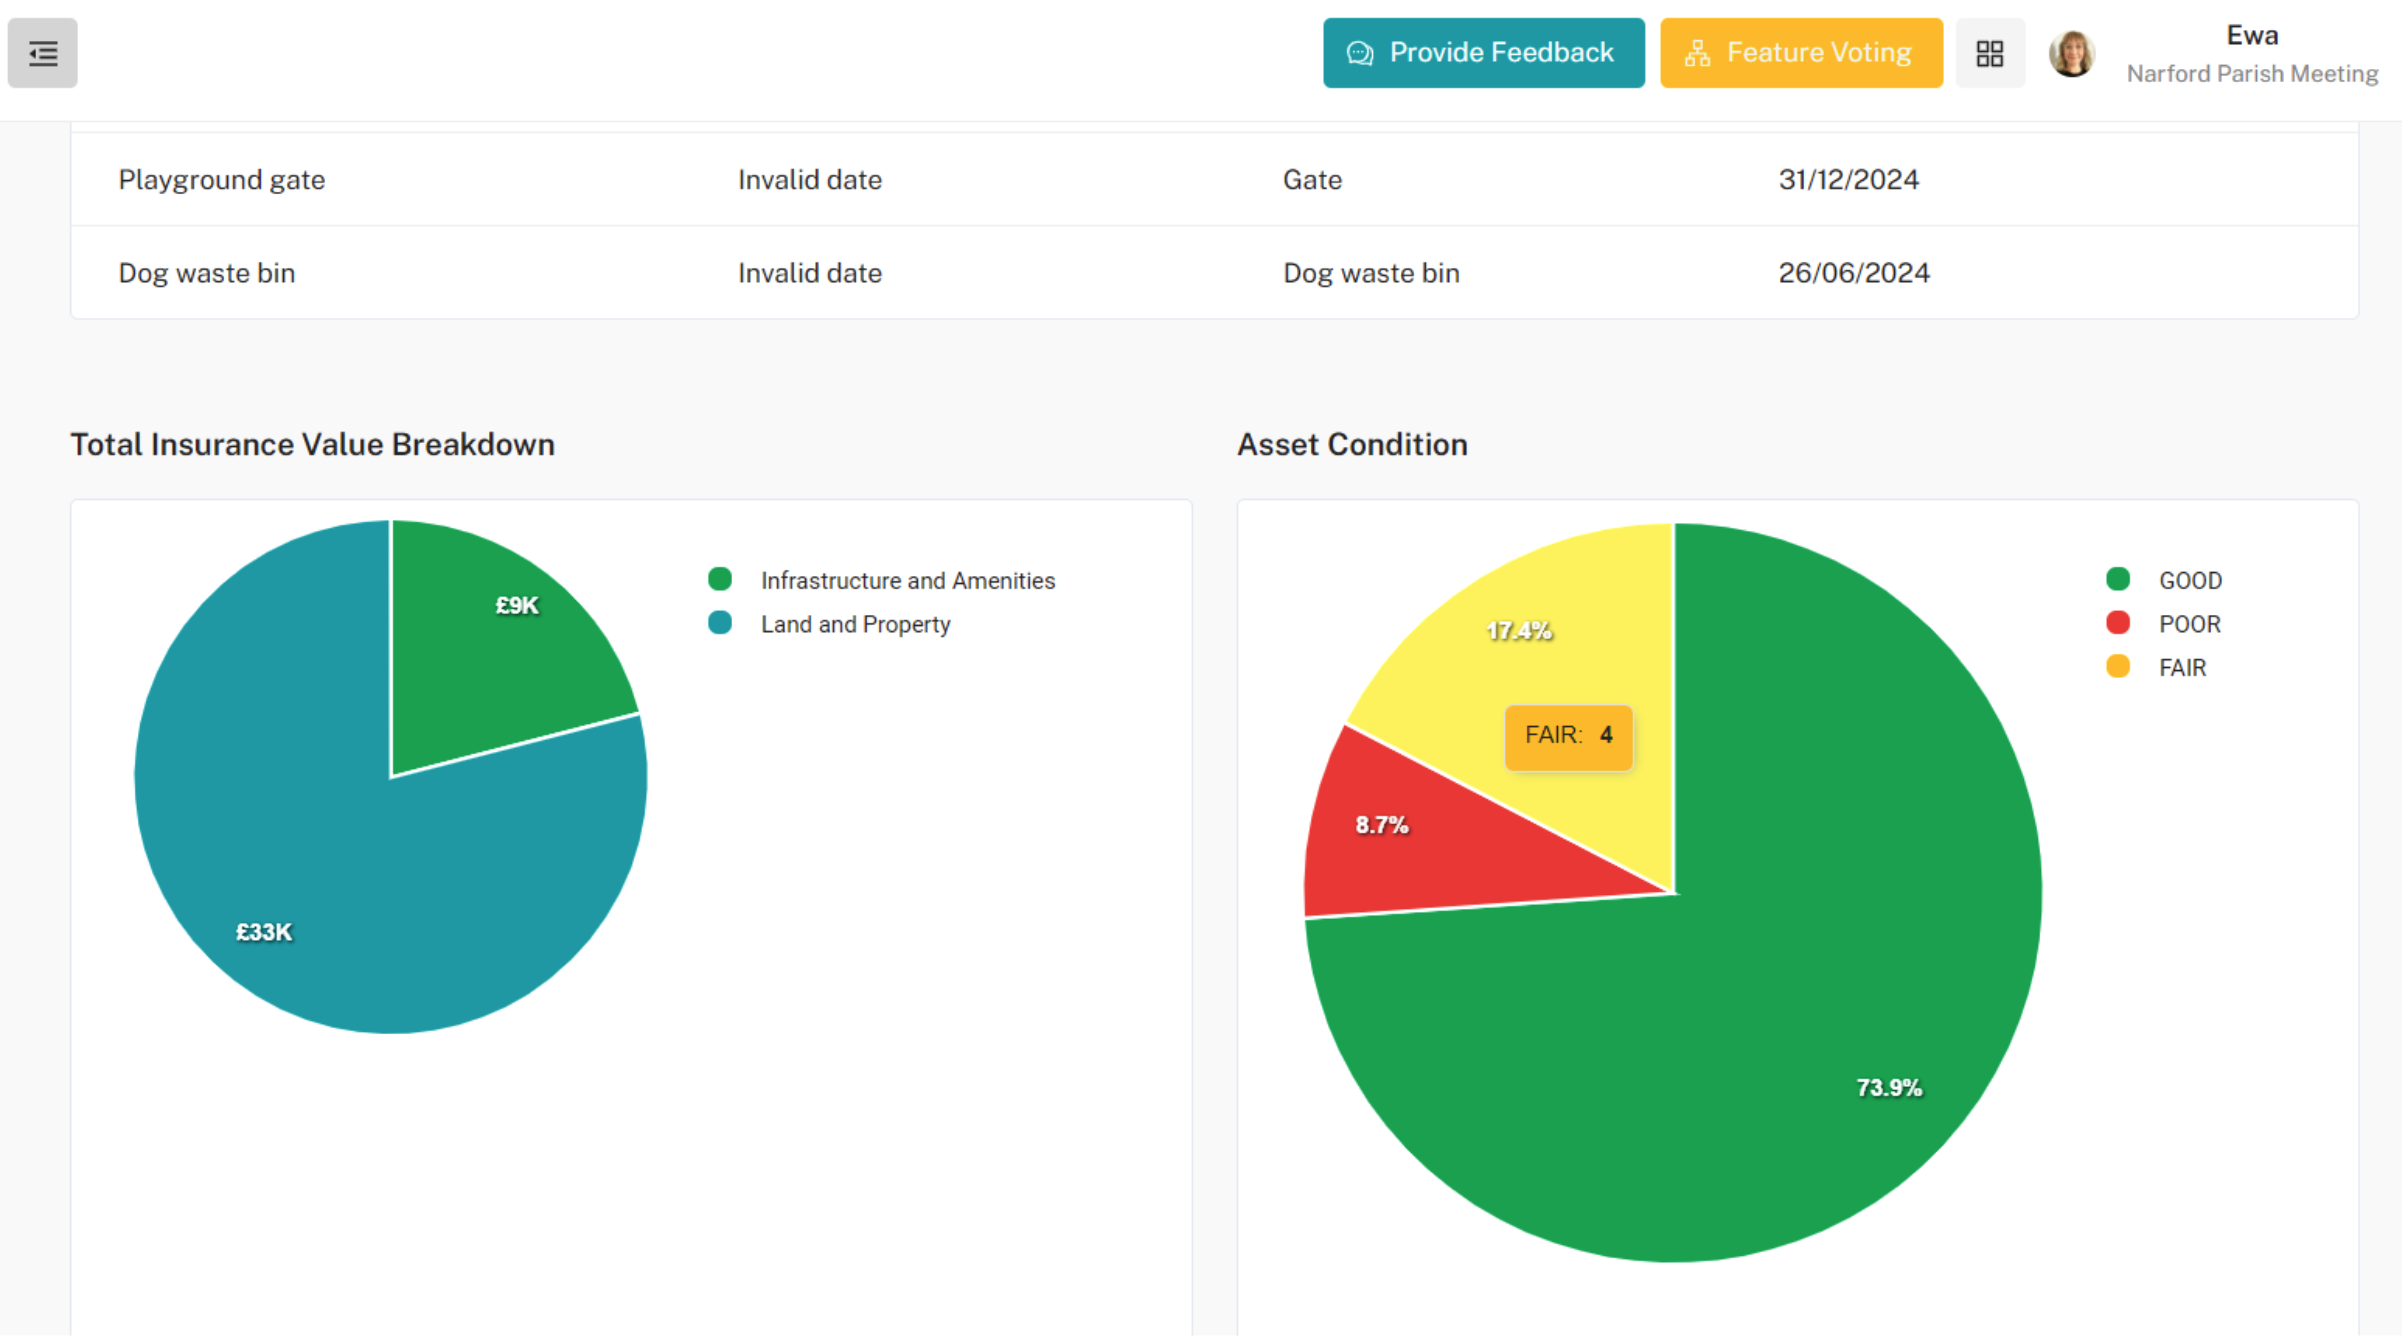
Click on "Fair" condition to get all records which are in Fair condition.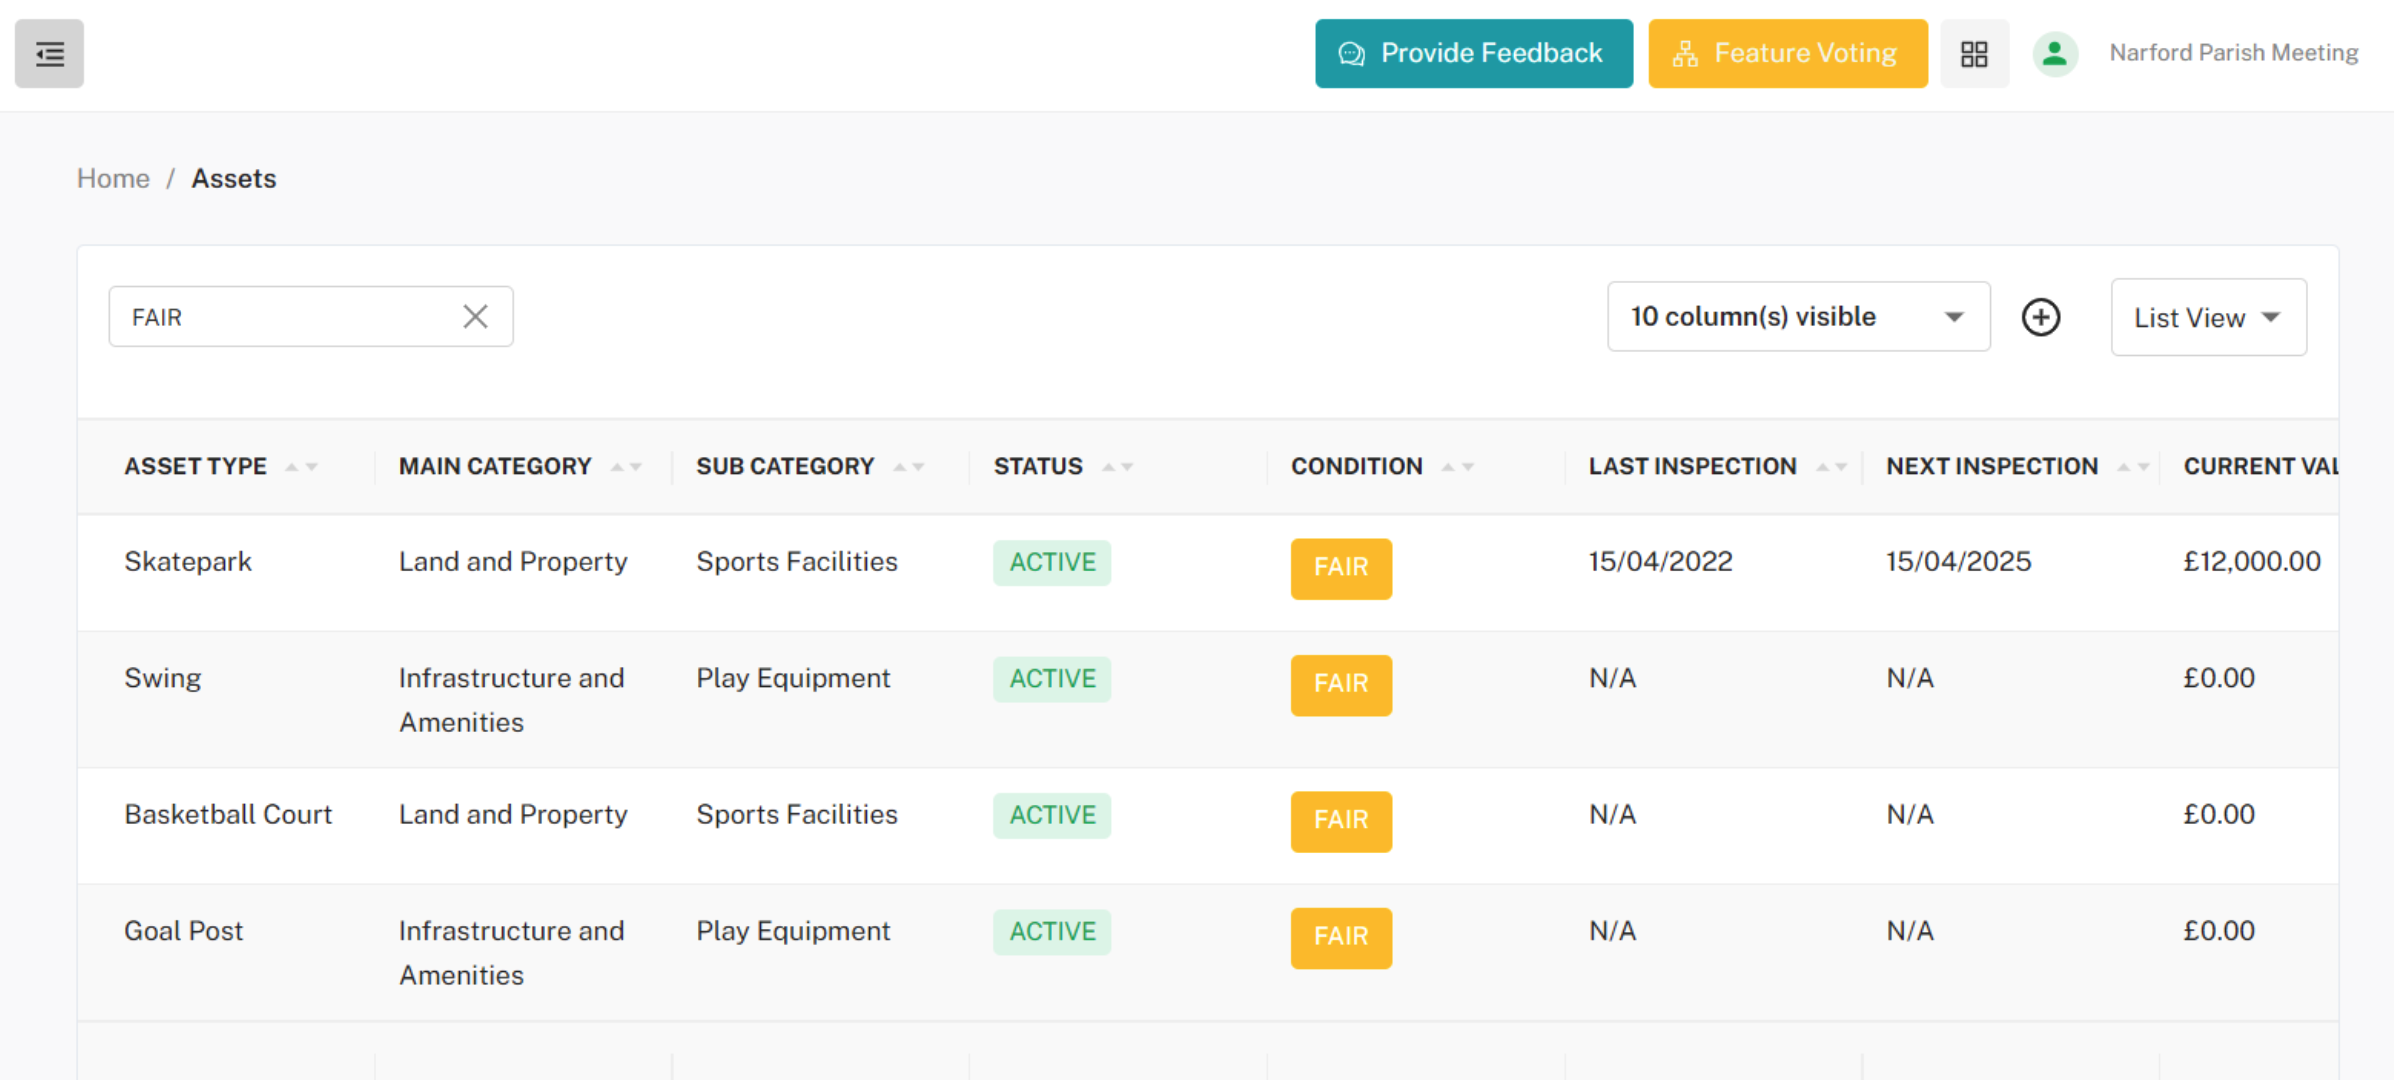
Improved Map Functionality
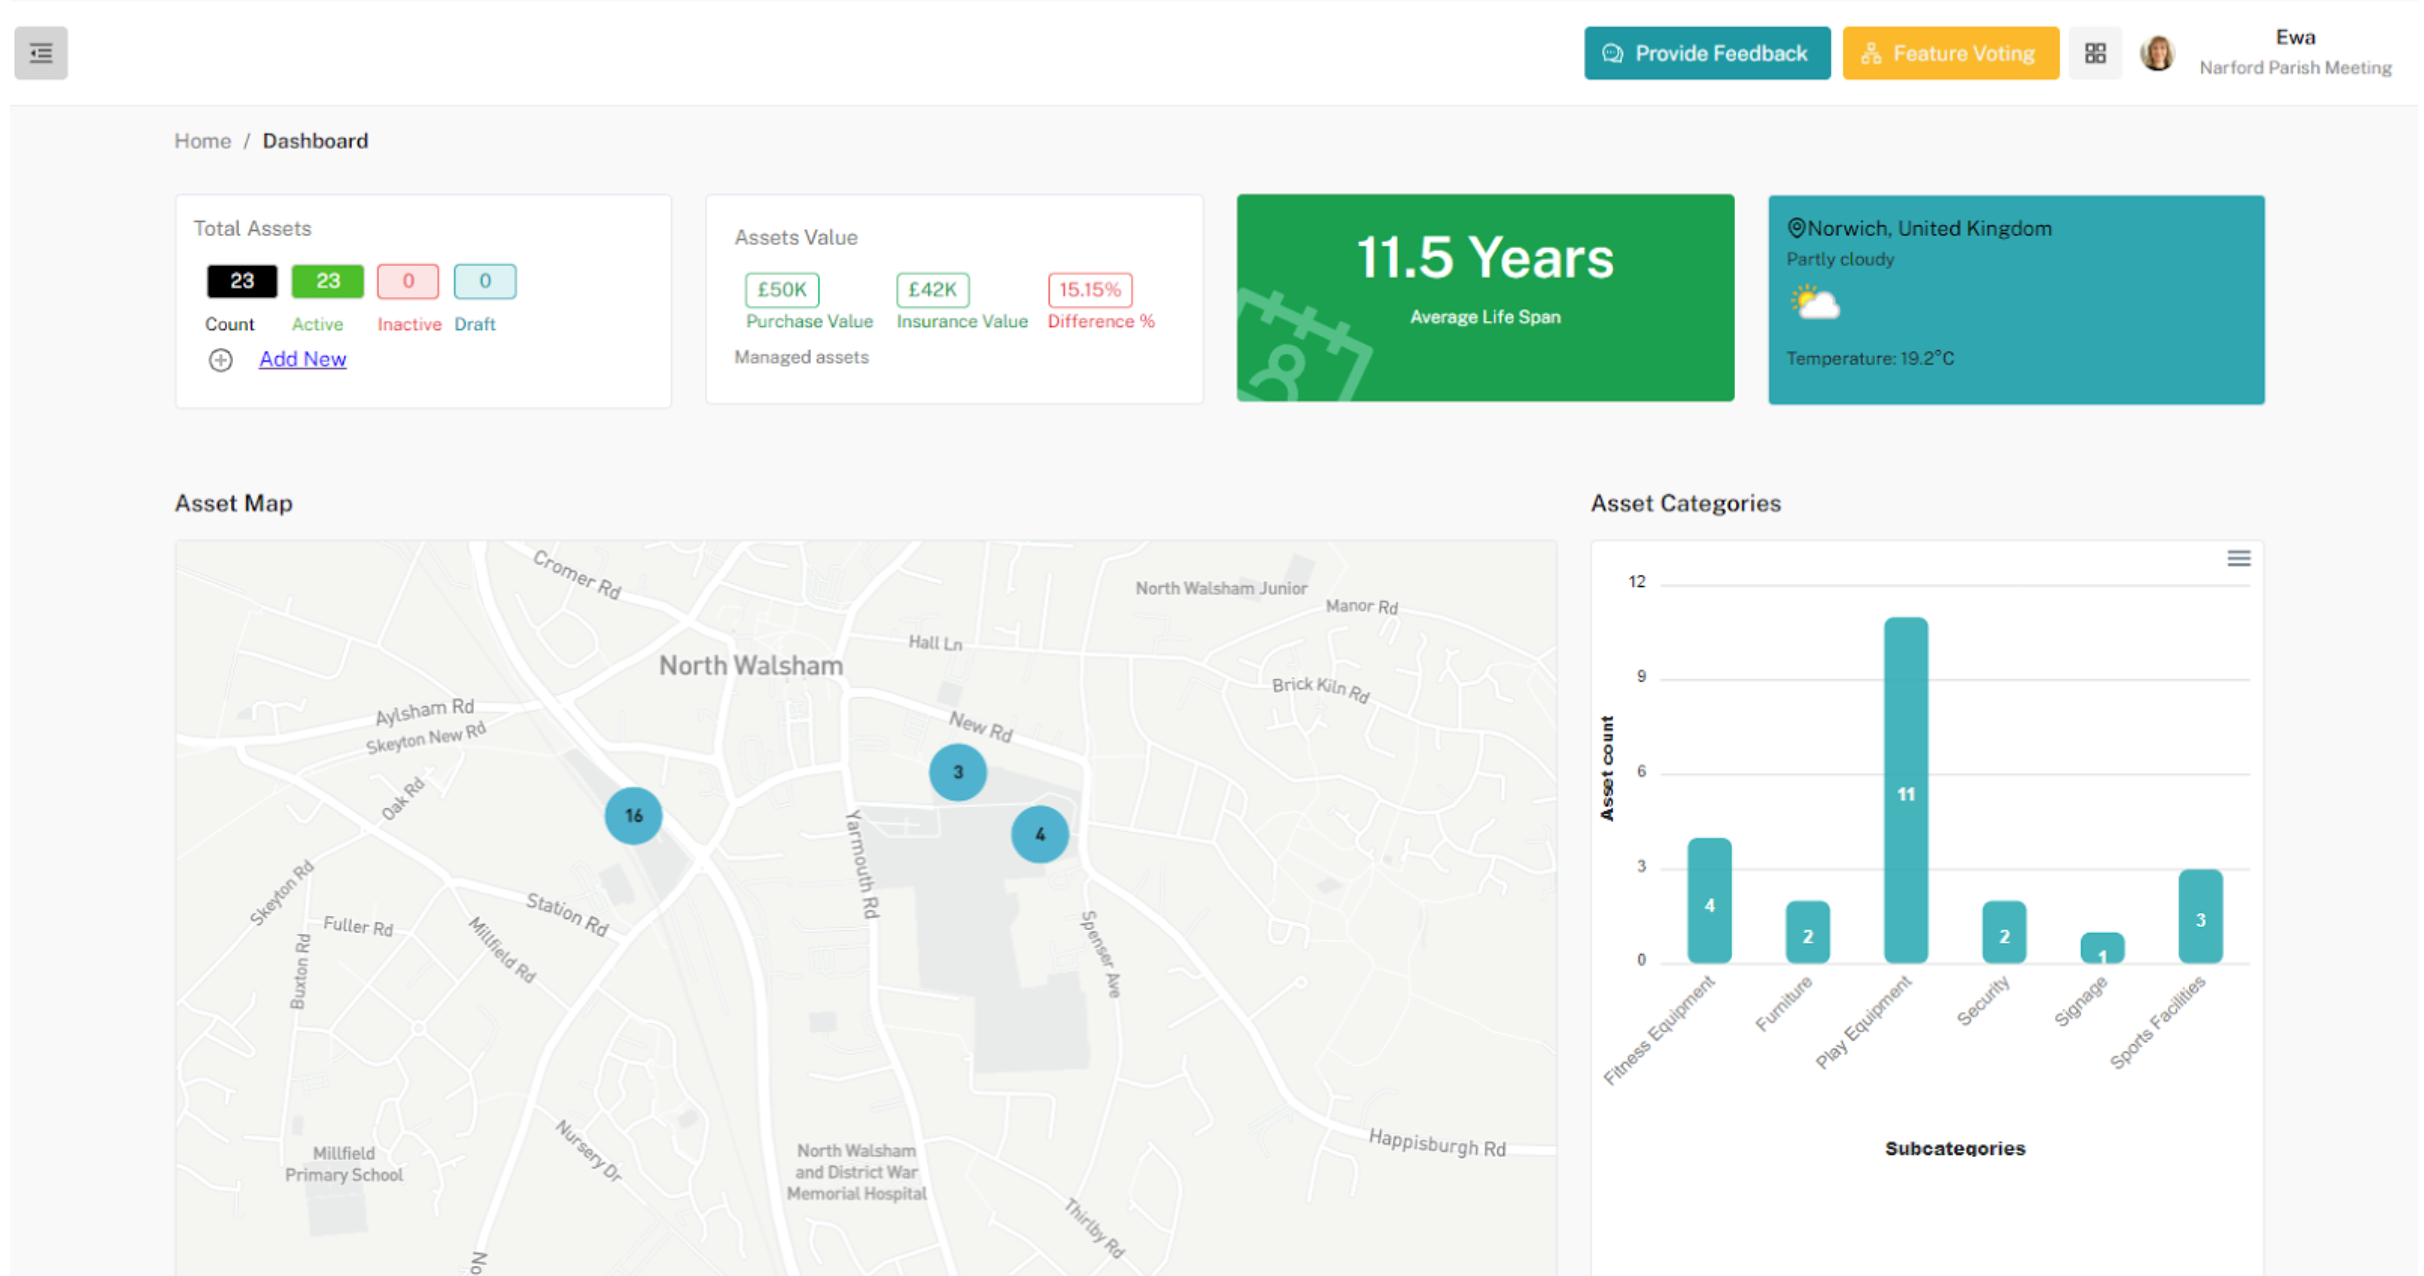
The map feature has been updated to display all assets, removing the previous limitation of 20 assets. This allows for a comprehensive view of all assets in your system.
Enhanced Asset Views
Both the Grid View and List View have received significant upgrades to improve data accessibility and sorting options.
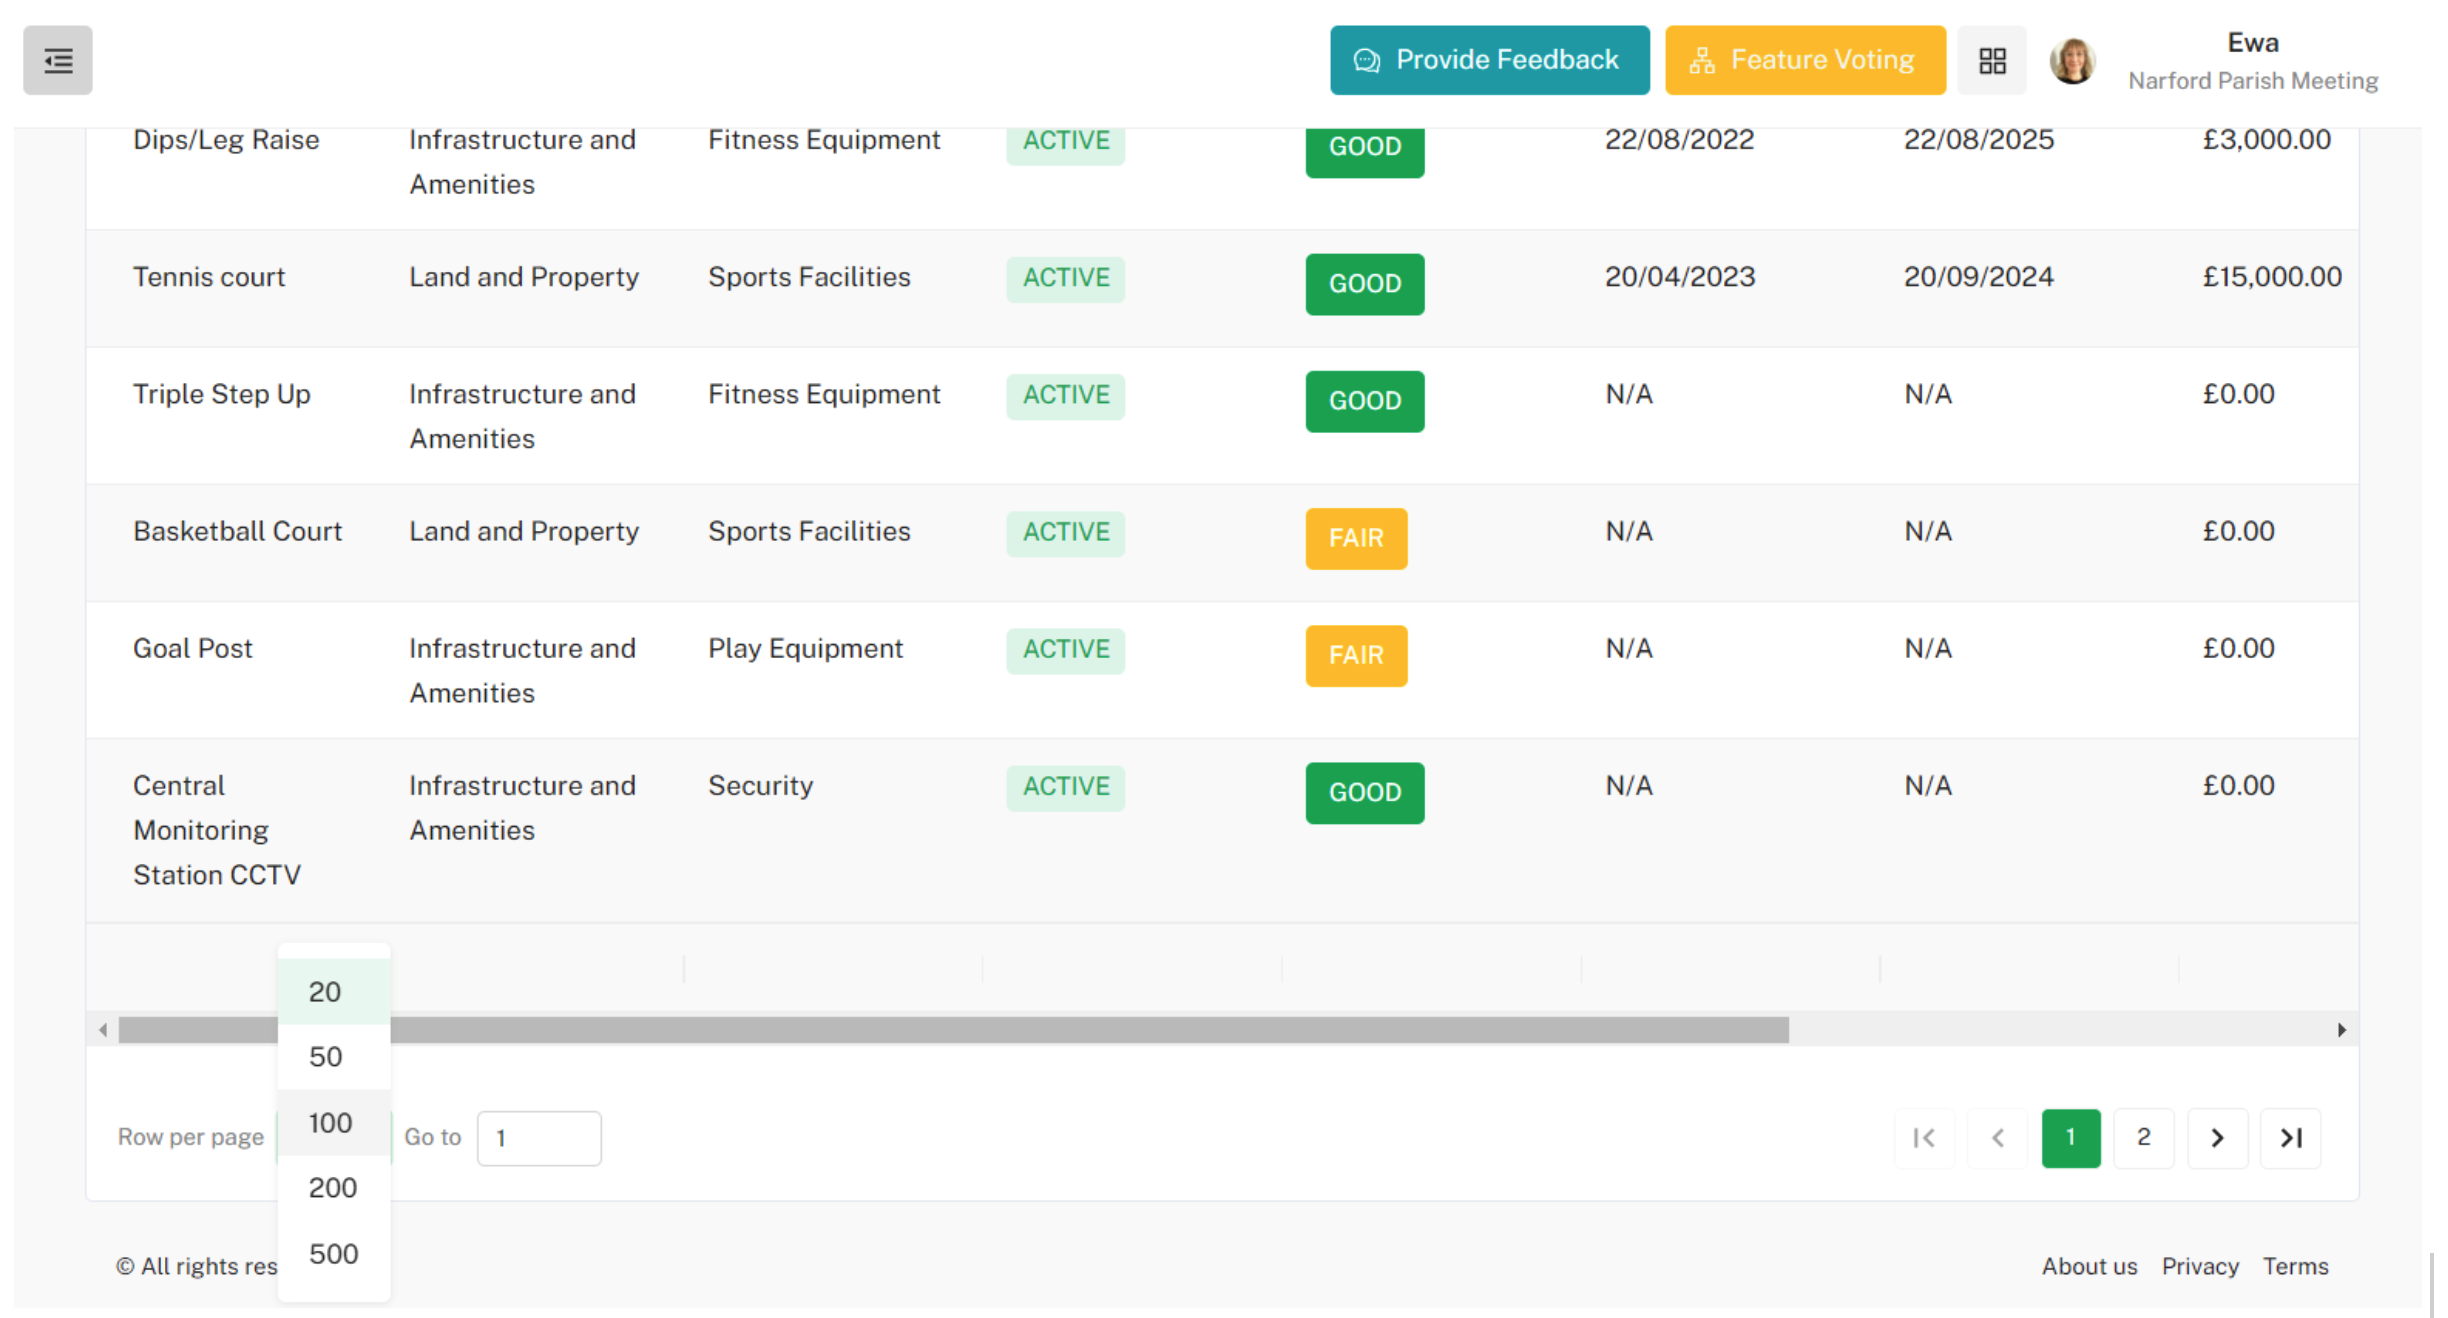
- List View Enhancements:
- Main and Sub-Category Columns: Added main and sub-category columns for better data organisation.
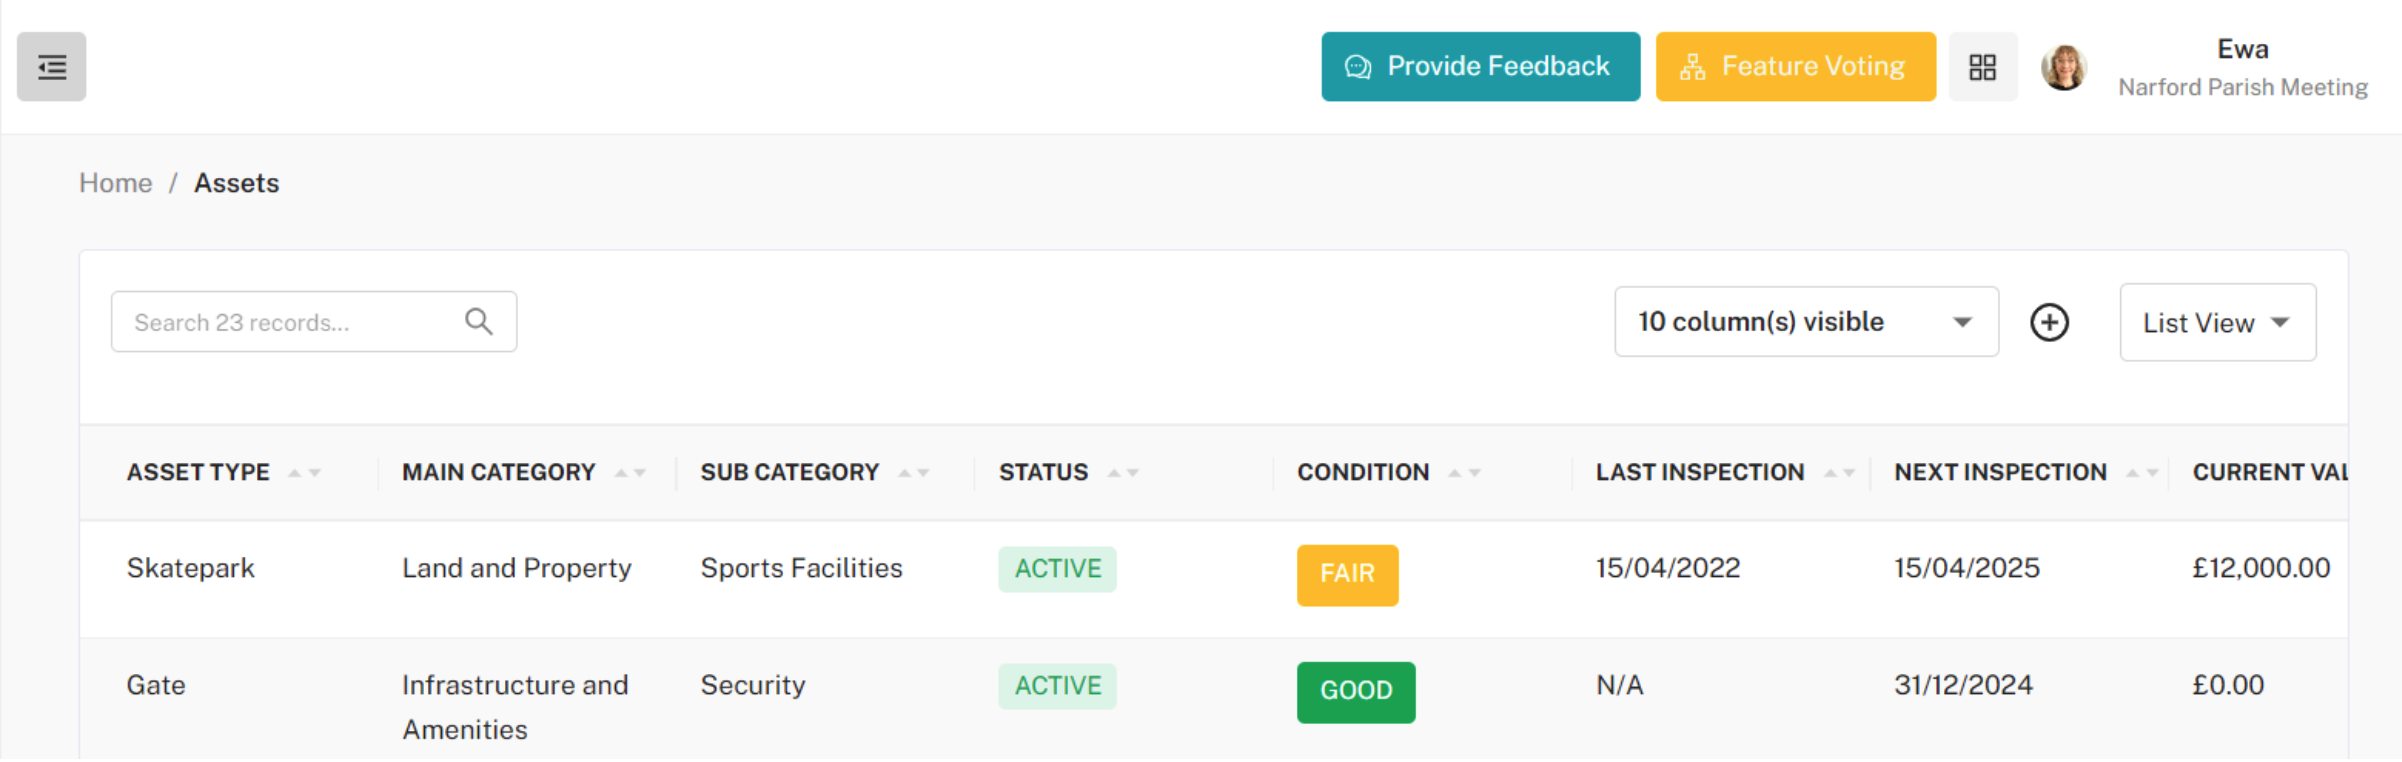
- Pagination Support: Now supports pagination with options for 20, 50, 100, 200, and 500 rows, enhancing the ease of data management.
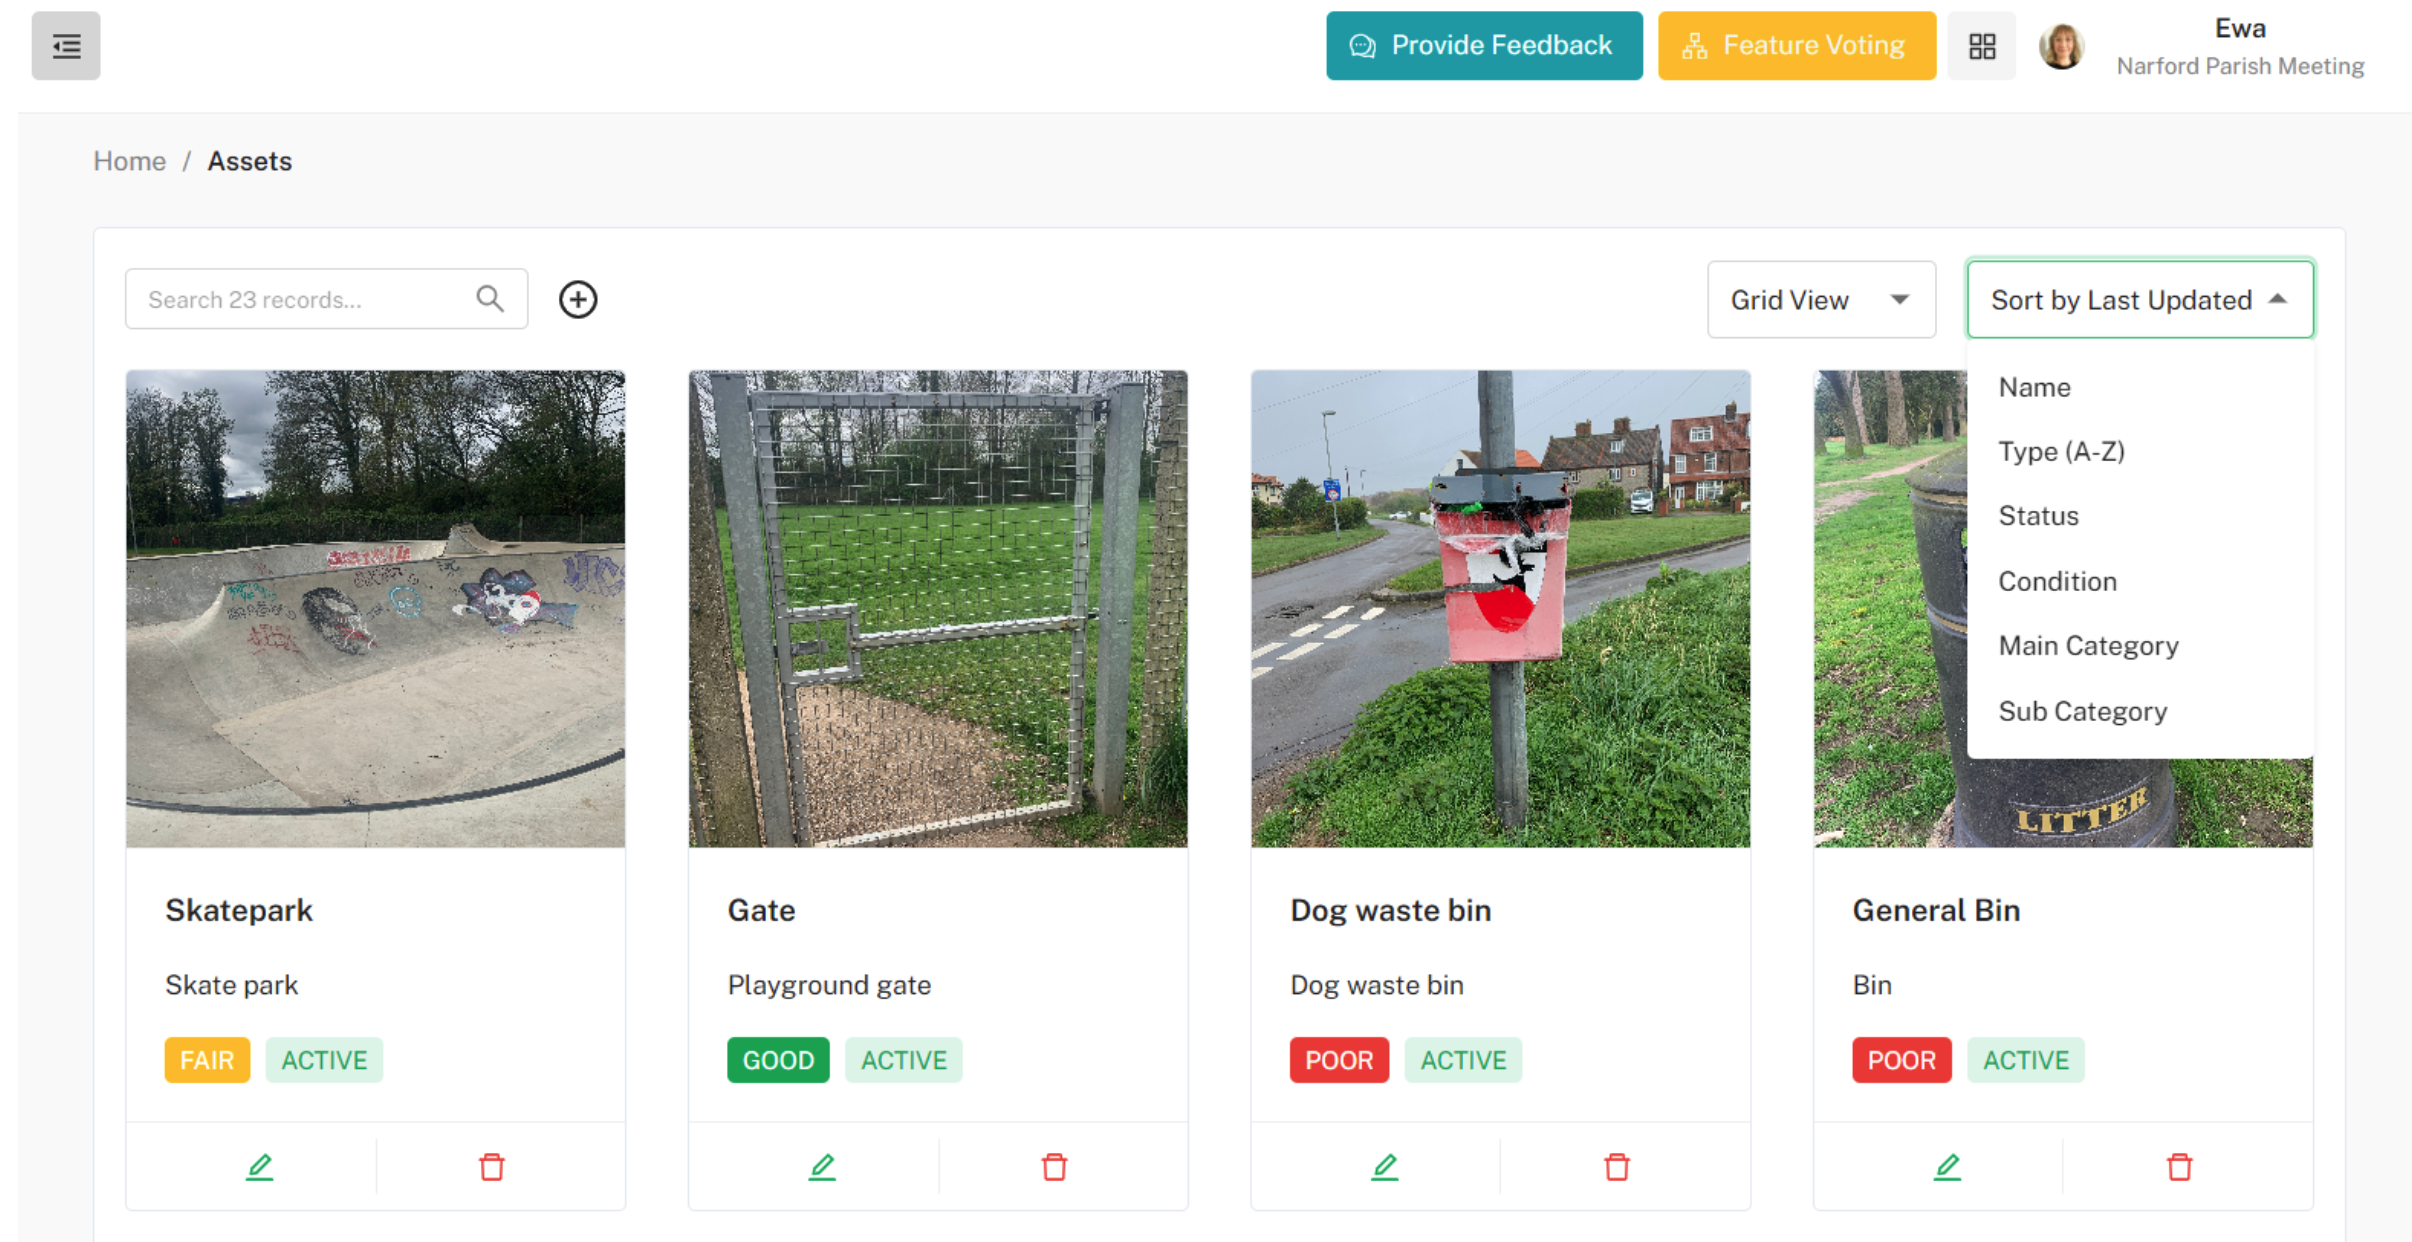
- Grid View Enhancements:
- Sort by Main and Sub Category: You can now sort assets by main and sub-categories.
- Sort by Asset Type and Status: Added sorting options by asset type and status for a more streamlined view.
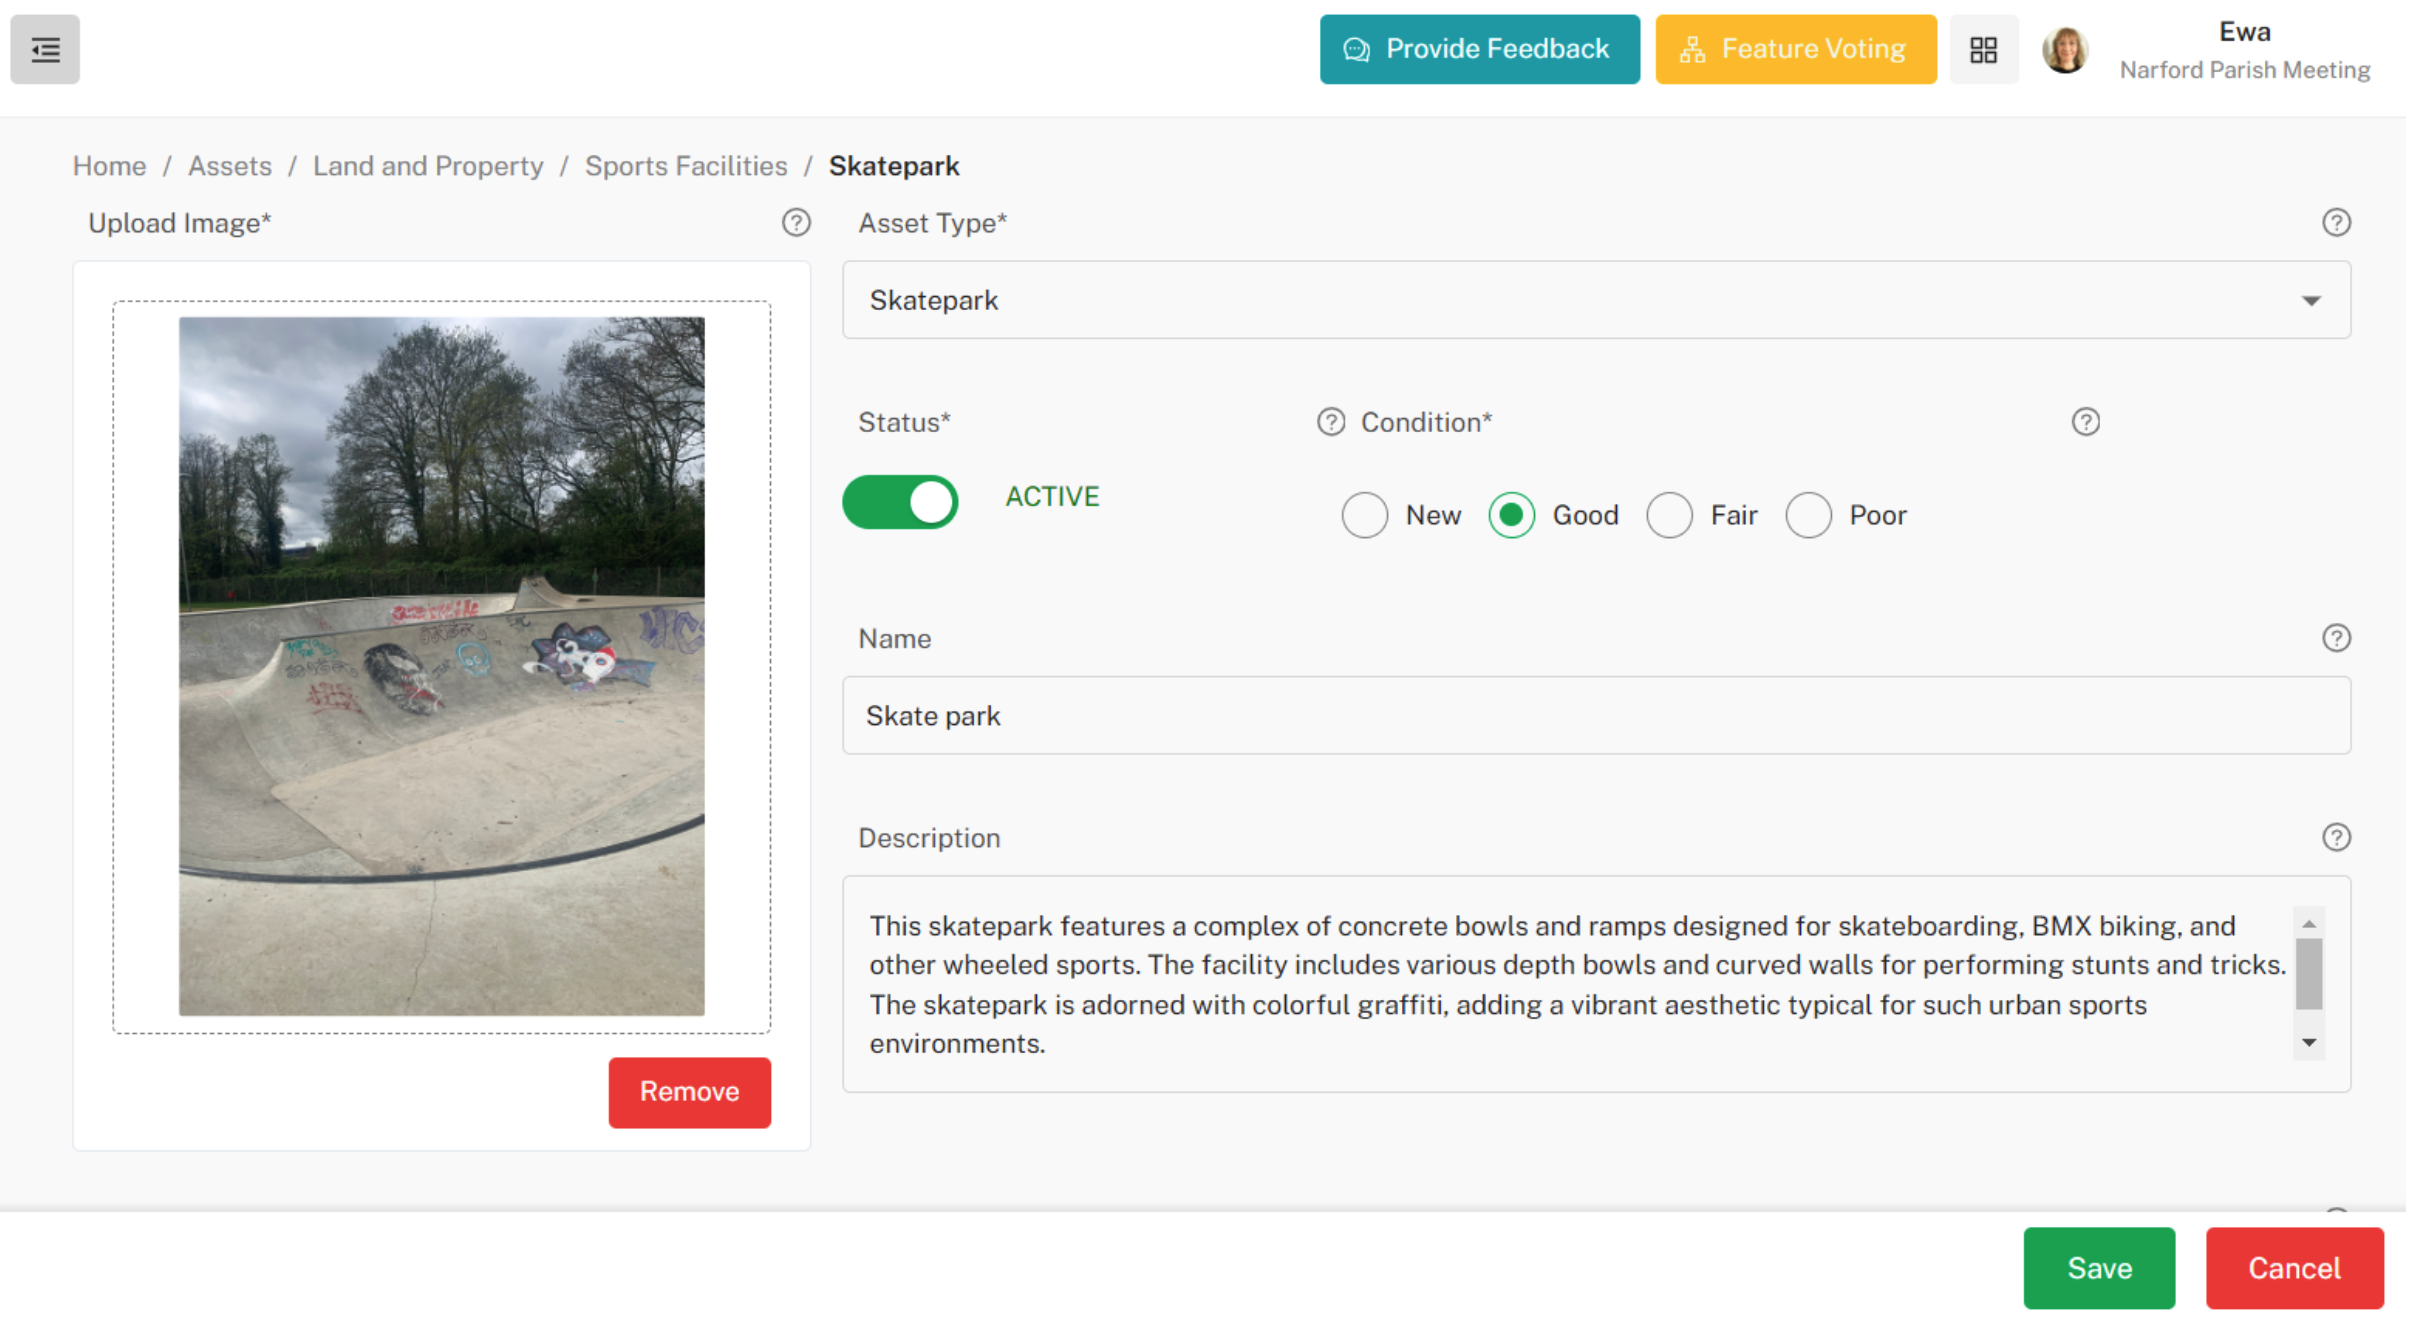
Asset Edit Page Improvements
To improve user experience and navigation, the following updates have been made:
- Breadcrumb Trail Fix: Resolved the issue where the breadcrumb trail was not showing.
- Sticky Footer with Save Button: Added a sticky footer with a save button to the asset edit page for easier saving of changes.
Did you find this article helpful?
0 of 0 found this article helpful.
0 of 0 found this article helpful.
Can't find what you're looking for?Log a ticket