What is a Monthly Report within Parish and Town Councils
Monthly Reports within Parish and Town Councils allow you to easily create and view a forecast for the current financial year which will show the expected end-of-year position for your council. This will assist with not only making informed decisions regarding the remainder of the current financial year but will also help when setting future budgets.
What is a Monthly Report within Scribe Accounts
Scribe Accounts has a specific report called monthly report which is part of Scribe’s forecasting facility allowing you to produce a report to see a breakdown of your actuals month on month and easily view the end-of-year position. This report removes the need to extract data into a spreadsheet and allows you to manage forecasting easily within your Scribe account.
Where is the Monthly Report within Scribe Accounts
Log into Scribe Accounts and navigate to menu Budgeting → Monthly Report alternatively click here
How To Generate A Monthly Report Within Scribe Accounts
💡 Before creating a report using forecasting in Scribe, forecasting options must be set against cost codes.
Log into Scribe Accounts and navigate to menu Budgeting → Monthly Report
To Include Forecasting:

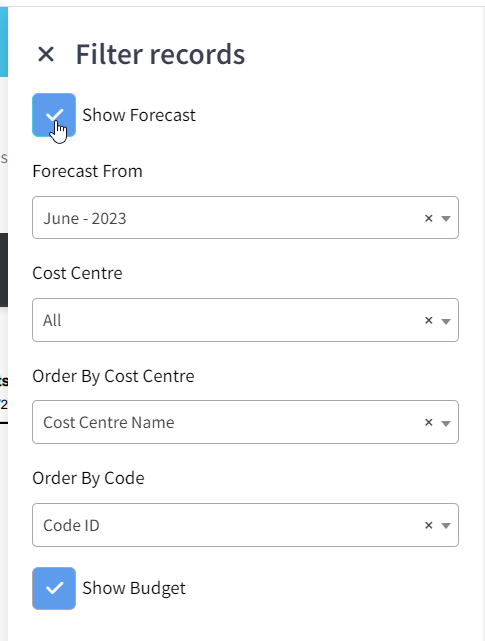
Click the Filter Button and then Tick the 'Show Forecast' option to enable forecast figures

Select the month from the dropdown menu for which you want to start showing forecast figures, Scribe will automatically select the "Current Month" (e.g., if all data is on and reconciled up to the end of October, select November).
Click 'View Report.' The report will display actual figures for each month up until the month selected under the Forecast option.
Forecasted figures will appear for the months starting from the selected month in the dropdown. The figures used for the forecast will be based on the settings under Setup/Cost Codes. The months will be totaled, and a variance will be shown against the budget.
To Exclude Forecasting:
Ensure the 'Show Forecast' option is not ticked.
Click 'View Report.' The report will display actual figures for each month, with no values appearing under months where no transactions have been entered.
If you want to hide the budget and variance columns, go to the Advanced option and untick the corresponding box. This will remove the budget and variance columns, displaying only the monthly amounts and total.
How to Download a Monthly Report
Once you have created your report you can download the report by simply selecting the Google ‘Download’ button,

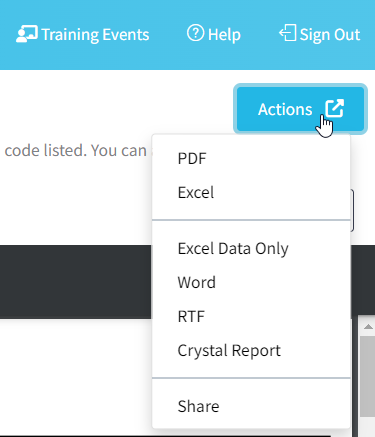
or by using the Actions button in the top right corner you can then choose the file format and the report will start downloading
. 
How to Print a Monthly Report
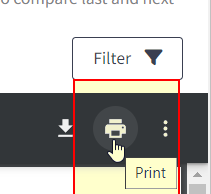
Once you have created your report you can print it by simply clicking the printer icon in the google print bar

How to Filter a Monthly Report
Before you generate your report using the above steps click the ‘Filter’ button. A single cost centre can be selected to just show the details for that cost centre.
The order of the report can also be changed by selecting in which order to display the cost centres and cost codes. By ID will list the cost centres in the order in which they were set up and the cost codes by their code number. By Name will list them alphabetically.
0 of 0 found this article helpful.